Q1FY2020 Result Update| banking
July 30, 2019
ICICI Bank
BUY
CMP
`429
Decent Q1 with stable asset quality
Target Price
`490
Investment Period
12 Months
Particulars (` cr)
Q 1FY20
Q 4FY19
% chg (qoq)
Q 1FY19
% chg (yoy)
NII
7,737
7,620
2
6,102
27
Stock Info
Pre-prov. profit
6,288
6,233
1
5,808
8
Sector
Banking
PAT
1,908
969
97
(120)
-
Market Cap (` cr)
2,77,000
Source: Company
Beta
1.3
For Q1FY2020, ICICI Bank reported net profit of `1,908Cr, which is marginally
52 Week High / Low
444/282
lower than estimates primarily owing to decline in other income and higher
Avg. Daily Volume
6,60,886
provision. However, on asset quality front, bank reported improvement on all
Face Value (`)
2
parameters. Slippage for the quarter came in at `2,779Cr, which has been
BSE Sensex
37,686
witnessing a declining trend for last several quarters. Management has guided
Nifty
11,189
credit cost of 1.2-1.3% for FY2020 and 1% for FY2021.
Reuters Code
ICBK.BO
Bloomberg Code
ICICIBC IN
Stable asset quality and stressed pool declined: During the quarter, the key
monitorable was higher slippages from kisan credit card portfolio (`450cr), which
led the increase in retail GNPA ratio by ~20bps qoq to 1.9%. Key positives for the
quarter were (1) decline in BB & below book by 40bps to 2.59% of advances; on
Shareholding Pattern (%)
absolute basis it reduced by `2,170Cr, (2) Management mentioned that exposure
Promoters
0.0
to new stressed corporate was limited, (3) PCR at 73% was amongst the highest in
industry, and (4) delinquency in retail business is less than industry..
MF / Banks / Indian Fls
34.8
Advances led by retail lending; NIM stable : The bank’s advances grew by 14.7%
FII / NRIs / OCBs
32.9
yoy (1% qoq) aided by healthy retail loan book growth of 23% yoy. The main
Indian Public / Others
8.4
drivers leading to the growth in the retail loan book were personal loans/credit
card lending, which grew by 55%/33% yoy respectively. Retail contribution to total
loans increased to 61.4% vs. 57.5% in Q1FY2019. NIM stood at 3.62% against
3.72% in Q4FY19, considering 17bps impact of refund and interest collection of
Abs. (%)
3m 1yr
3yr
NPA. CASA ratio declined to 45.2% vs. 49.6% in Q4FY2019 as growth in term
deposits outpaced that in CASA deposits.
Sensex
(3.3)
0.9
33.6
ICICI Bank
8.7
46.3
73.4
Outlook & Valuation: At the current market price, the bank’s core banking
business (after adjusting the value of subsidiaries) is trading at 1.7x FY2021E
ABV. We believe strength of liability franchise (CASA - 45%), shift in loan mix
towards retail assets & better rated companies, strong capitalization (tier I of
14.6%), steady improvement in stressed loan and going forward quick resolution
under IBC would be the key triggers for expansion. We recommend a Buy on the
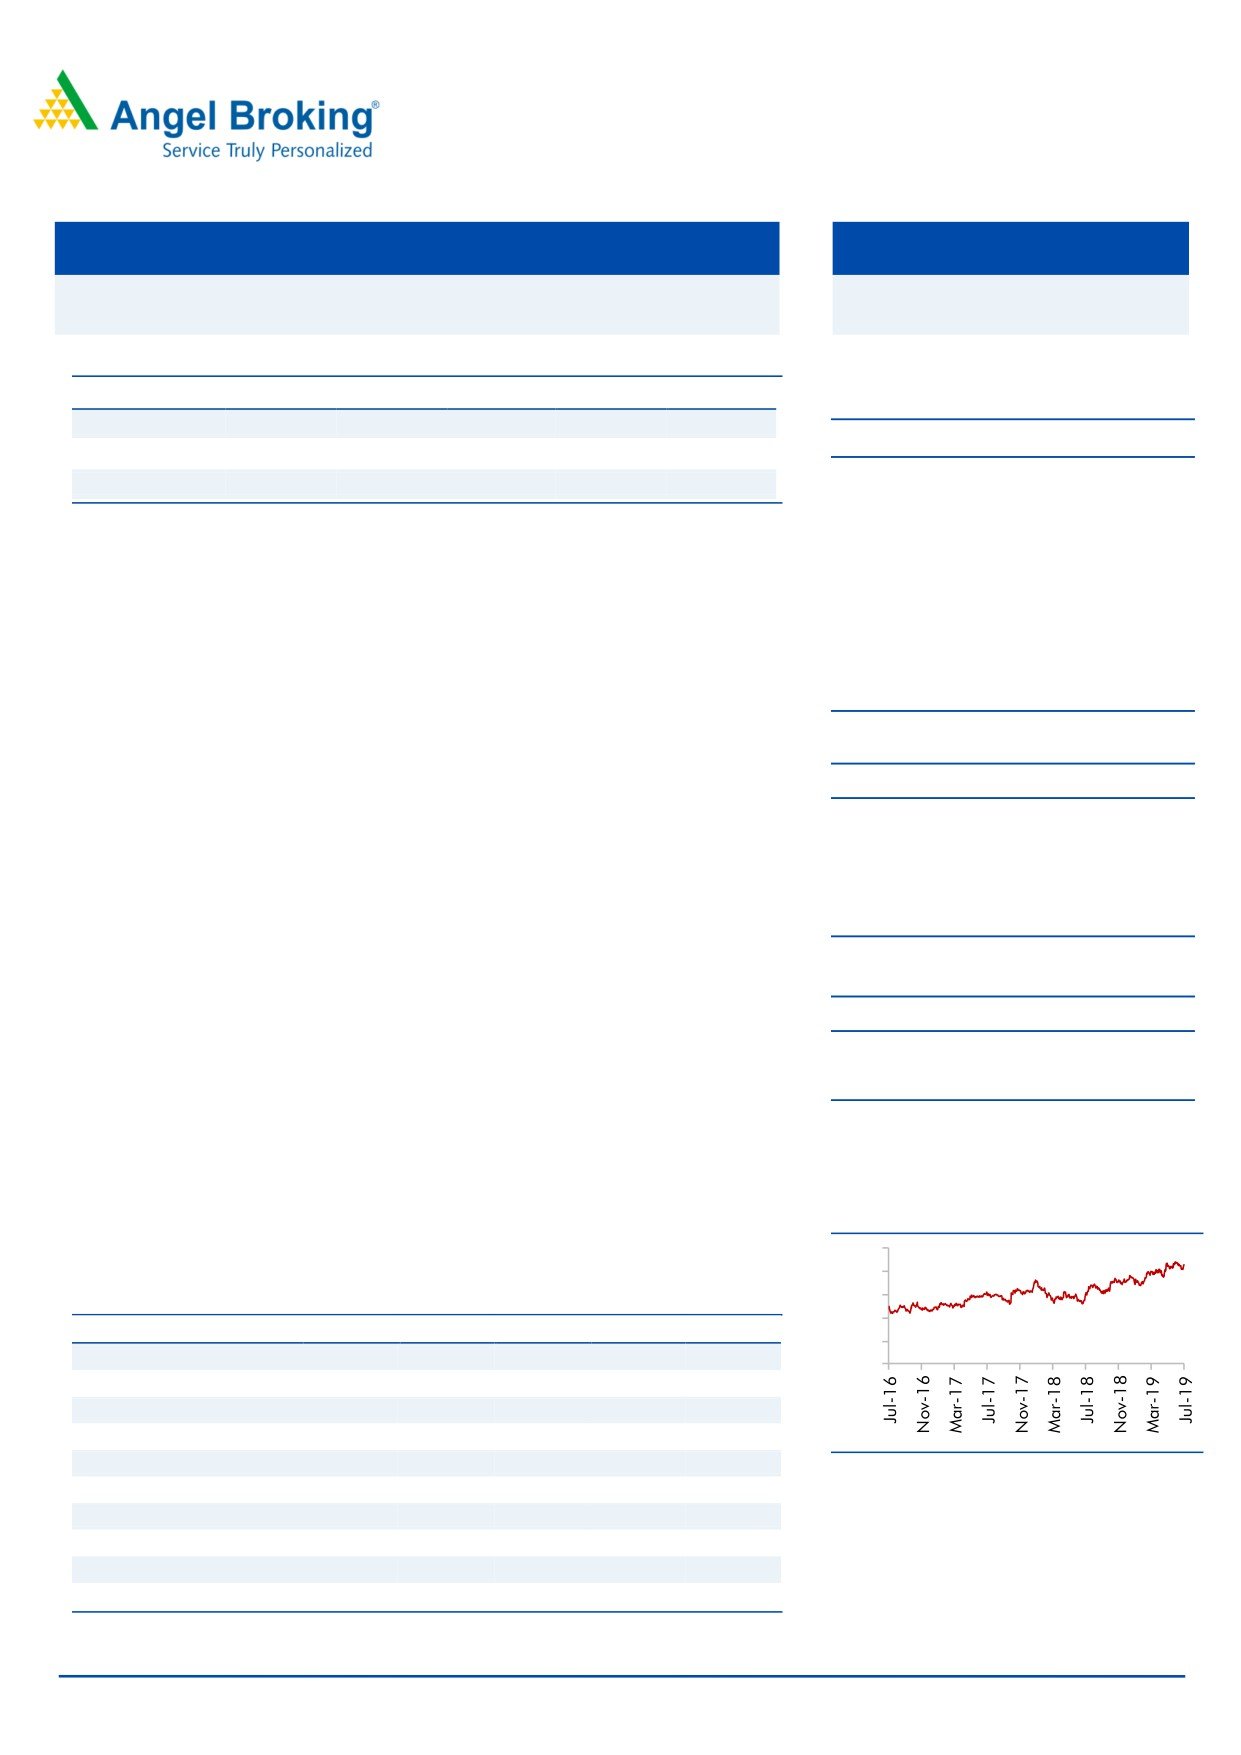
3 Year Price Chart
stock with a Target Price of `490.
500
400
300
Exhibit 1: Key Financials
200
Y/E March (` cr)
FY17
FY18
FY19
FY20E
FY21E
100
NII
21,738
23,025
27,015
31,732
37,135
0
% chg
2
6
17
17
17
Net profit
9,802
6,645
3,362
12,250
16,518
% chg
0.8
(32.2)
(49.4)
264
35
NIM (%)
3.2
3.1
3.2
3.4
3.5
Source: Company
EPS (`)
15
10
5
19
26
P/E (x)
28
42
82
23
17
P/ABV (x)
3.6
3.3
2.8
2.5
2.3
Jaikishan Parmar
RoA (%)
1.3
0.8
0.4
1.2
1.4
Research Analyst
RoE (%)
10.3
6.5
3.1
10.8
13.2
022 - 39357600 Ext: 6810
Source: Company, CMP as on 29/7/2019, Valuation done closing price of 29/7/2019
Please refer to important disclosures at the end of this report
1
ICICI Bank | 1QFY2020 Result Update
Exhibit 1: Quarterly Performance
Particulars (` cr)
Q 4FY18
Q 1FY19
Q 2FY19
Q 3FY19
Q 4FY19
Q 1FY20 % chg (qoq)
% chg (yoy)
I nterest Earned
14,264
14,722
15,106
16,280
17,293
17,980
4
22
on Advances / Bills
10,690
10,982
11,512
12,524
12,925
13,616
5
24
on i nvestments
3,001
3,136
3,086
3,237
3,338
3,645
9
16
on bal with RBI & others
166
227
147
135
227
147
(35)
(35)
on others
406
378
360
385
802
571
(29)
51
I nterest Expe nded
8,243
8,620
8,688
9,405
9,673
10,243
6
19
Net Interest Income
6,022
6,102
6,418
6,875
7,620
7,737
2
27
Non Intere st Income
5,678
3,851
3,156
3,883
3,621
3,425
(5)
(11)
Fee Income
2,755
2,754
2,995
3,062
3,178
3,039
(4)
10
Other Income
238
331
197
342
269
191
(29)
(42)
Treasury Income
2,685
766
(350)
479
156
196
26
(74)
Operating income
11,700
9,953
9,574
10,758
11,241
11,163
(1)
12
Operating Expenses
4,186
4,145
4,324
4,612
5,008
4,874
(3)
18
Empl oyee expenses
1,526
1,514
1,661
1,734
1,899
1,953
3
29
Other Opex
2,660
2,631
2,663
2,878
3,109
2,921
(6)
11
Pre-prov. profit
7,513
5,808
5,250
6,146
6,233
6,288
1
8
Provisions & Contingencies
6,626
5,971
3,994
4,244
5,451
3,496
(36)
(41)
PBT
888
(164)
1,255
1,902
782
2,793
257
(1,806)
Provision for Taxes
(132)
(43)
347
297
(187)
885
(573)
-
Tax rate
(15)
26
28
16
(24)
32
(223)
PAT
1,019
(120)
909
1,605
969
1,908
97
-
Source: Company
Exhibit 2: Balance Sheet
Particular
Q 4FY18
Q 1FY19
Q 2FY19
Q 3FY19
Q 4FY19
Q 1FY20
% chg (qoq)
% chg (yoy)
A dvance (` cr)
5,12,395
5,16,289
5,44,487
5,64,308
5,86,647
5,92,415
1.0
14.7
Deposit (` cr)
5,60,975
5,46,878
5,58,669
6,06,755
6,52,920
6,60,732
1.2
21
Credit-to-De posit Rati o (%)
91
94
97
93
90
90
(18.9)bp
(474.6)bp
CA (` cr)
88,958
76,689
76,072
88,581
96,269
80,401
(16)
5
SA (` cr)
2,00,967
1,99,604
2,07,476
2,10,793
2,27,671
2,18,476
(4)
9
CASA de posits (` cr)
2,89,925
2,76,293
2,83,548
2,99,374
3,23,940
2,98,877
(8)
8
CASA %
51.7
50.5
50.8
49.3
49.6
45.2
(438)bp
(528.8)bp
Tier-I ratio (%)
15.9
15.8
15.4
15.1
15.1
14.6
(49)bp
(124)bp
of w hich - CET1
14.4
14.4
14.0
13.7
13.6
13.2
(43)bp
(121)bp
Tier-II ratio
2.5
2.5
2.5
2.0
1.8
1.6
(21)bp
(92)bp
Total CAR ratio
18.4
18.4
17.8
17.2
16.9
16.2
(70)bp
(216)bp
Source: Company
July 30, 2019
2
ICICI Bank | 1QFY2020 Result Update
Exhibit 3: Profitability Ratios & Asset quality Trend
Particular
Q 4FY18
Q 1FY19
Q 2FY19
Q 3FY19
Q 4FY19
Q 1FY20 % chg (qoq)
% chg (yoy)
Rep. Yield on Advance
8.68
8.71
8.79
9.00
9.29
9.36
7bp
65bp
Rep. Cost of fund
4.93
4.99
5.00
5.14
5.20
5.23
3bp
24bp
Cost of De posit
4.79
4.81
4.76
4.88
5.00
5.08
8bp
27bp
Reported NIM
3.24
3.19
3.33
3.22
3.72
3.61
(11)bp
42bp
Cost-to-income ratio
35.8
41.6
45.2
42.9
44.5
43.7
(88.2)bp
201.7bp
Asset quality
Gross NPAs (` cr)
54,063
53,465
54,489
51,627
46,328
45,799
(1)
(14)
Gross NPAs (%)
8.8
8.8
8.5
7.8
6.7
6.5
(21)bp
(232)bp
Net NPAs (` cr)
27,886
24,170
22,086
16,288
13,613
11,893
(13)
(51)
Net NPAs (%)
4.8
4.2
3.7
2.6
2.1
1.8
(29)bp
(242)bp
PCR (%)
46
52
57
67
69
73
347.4bp
2028.7bp
Slippage ratio (%)
3.1
0.8
0.6
0.4
0.6
0.5
(13.6)bp
(31.3)bp
Credit Cost on Adv (Annl)
5.2
4.6
3.0
3.1
3.8
1.6
(218.9)bp
(304.4)bp
Source: Company
Exhibit 4: Stressed book on declining trend
Particular (` Cr)
1QFY18
2QFY18
3QFY18
4QFY18
1QFY19
2QFY19
3QFY19
4QFY19
Q 1FY20
GNPA
43,148
44,489
46,039
54,063
53,465
54,489
51,627
46,328
45,799
Outstanding stock of bad loans
28,300
28,300
25,800
13,461
11,898
10,720
3,690
3,299
3,280
(% of l oans)
6.1%
5.9%
5.1%
2.6%
2.3%
2.0%
0.7%
0.6%
0.6%
Stressed asset
Sub inve stme nt grade
20,400
19,600
19,100
4,728
4,401
3,283
Security receipts
3,400
3,500
3,400
3,438
3,438
3,436
3,299
3,299
3,280
Other dispensation
4,500
5,200
3,300
5,295
4,059
4,001
391
Restructured loans
2,400
2,000
1,800
1,595
1,445
1,443
391
...5.25
200
200
200
-
2,004
2,005
SDR
1,500
2,700
1,000
-
-
S4A
400
300
300
2,200
610
553
Other
1,500
-
BB & Below
17,100
18,812
17,525
15,355
Total Stresse d Pool
71,448
72,789
71,839
67,524
65,363
82,309
74,129
67,152
64,434
Stressed pool to loans (%)
15.4
15.1
14.2
13.2
12.7
15.1
13.1
11.4
10.9
Stressed pool declared as NPA%
60
61
64
80
82
66
70
69
71
Source: Company
July 30, 2019
3
ICICI Bank | 1QFY2020 Result Update
Outlook & Valuation: At the current market price, the bank’s core banking
business (after adjusting the value of subsidiaries) is trading at 1.7x FY2021E ABV.
We believe strength of liability franchise (CASA - 45%), shift in loan mix towards
retail assets & better rated companies, strong capitalization (tier I of 14.6%), steady
improvement in stressed loan and going forward quick resolution under IBC would
be the key triggers for expansion. We recommend a Buy on the stock with a Target
Price of `490.
Exhibit 5: SOTP
Valuati on
Value/share
Particular
%
Methodology
(`)
Value of ICICI standalone
100
2x FY21E ABV
383
Subsidi aries
ICICI Prudential Life
54.9
On Current Mcap
47
General Insurance
56
On Current Mcap
45
Mutual fund s
51
5.5% of current AUM
15
Other (Home Fin, VC, Securities
27
PD and Overse as subsi diaries)
Total subsidiaries' value @ 20% di scount
108
Fair value per share
490
Valuation done on closing price of 29/07/2019
July 30, 2019
4
ICICI Bank | 1QFY2020 Result Update
Income Statement
Y/E March (` cr)
F Y17
F Y18
F Y19
F Y20E
F Y21E
Net Interest Income
21,738
23,025
27,015
31,732
37,135
- YoY Growth (%)
2
6
17
17.5
17.0
Other Income
19,503
17,419
14,511
15,231
18,296
- YoY Growth (%)
27
(11)
-17
5
20
O perating Income
41,241
40,444
41,526
46,963
55,431
- YoY Growth (%)
13
(2)
3
13
18
O perating Expenses
14,754
15,704
18,089
20,327
23,402
- YoY Growth (%)
16
6
15
12
15
Pre - Provision Profit
26,487
24,741
23,437
26,636
32,029
- YoY Growth (%)
11
(7)
-5
14
20
Prov. & Cont.
15,207
17,307
19,661
10,055
10,005
- YoY Growth (%)
30
14
14
(49)
(0)
Profit Before Tax
11,279
7,434
3,776
16,581
22,023
- YoY Growth (%)
(8)
(34)
-49
339
33
Prov. for Taxation
1,478
789
413
4,332
5,506
- as a % of PBT
13
11
11
26
25
PAT
9,802
6,645
3,362
12,250
16,518
- YoY Growth (%)
1
(32)
(49.4)
264
35
Balance Sheet
Y/E March (` cr)
F Y17
F Y18
F Y19
F Y20E
F Y21E
Equity
1,171
1,292
1,294
1,295
1,295
Reserve & Surplus
98,780
1,03,868
1,07,074
1,17,377
1,30,591
Networth
99,951
1,05,160
1,08,368
1,18,673
1,31,887
Deposits
4,90,039
5,60,975
6,52,920
7,32,565
8,40,635
- Growth (%)
16
14
16
12
15
Borrowings
1,47,556
1,82,859
1,65,320
1,73,004
2,02,390
Other Liab. & Prov.
34,245
30,195
37,851
50,549
75,668
T otal Liabilities
7,71,791
8,79,189
9,64,459
10,74,790
12,50,580
Cash Balances
31,702
33,102
37,858
43,288
49,674
Bank Balances
44,011
51,067
42,438
33,128
38,015
Investments
1,61,507
2,02,994
2,07,733
2,35,682
2,72,942
A dvances
4,64,232
5,12,395
5,86,647
6,59,995
7,72,100
- Growth (%)
7
10
14
13
17
Fixed Assets
7,805
7,904
7,931
11,235
12,892
Other Assets
62,535
71,727
81,852
91,463
1,04,956
T otal Assets
7,71,791
8,79,189
9,64,459
10,74,790
12,50,580
- Growth (%)
7
14
10
11
16
July 30, 2019
5
ICICI Bank | 1QFY2020 Result Update
Key Ratio
Y/E March
F Y17
F Y18
F Y19
F Y20E
F Y21E
Profitability ratios (%)
NIMs
3.2
3.1
3.2
3.4
3.5
Cost to Income Ratio
36
39
44
43
42
RoA
1.3
0.8
0.4
1.2
1.4
RoE
10
6
3
11
13
B/S ratios (%)
CASA Rati o
50
52
50
47
49
Credit/Deposit Rati o
0.95
0.91
0.90
0.90
0.92
Asset Quality (%)
Gross NPAs
7.9
8.8
6.7
5.2
3.8
Net NPAs
4.9
3.5
2.0
1.6
1.1
Slippages
7.5
6.4
2.5
2.0
1.5
Loan Loss Prov. /Avg. Assets
2.04
2.10
2.13
0.99
0.86
Provision Coverage
40
48
71
70
70
Per Share Data (`)
EPS
15
10
5
19
26
ABVPS (70% cover.)
119
129
153
169
189
DPS
2
2
1
4
5
Valuation Ratios
PER (x)
28
42
82
23
17
P/ABVPS (x)
3.6
3.3
2.8
2.5
2.3
Dividend Yield (%)
0.5
0.5
0.2
0.9
1.2
DuPont Analysis
NII
2.9
2.8
2.9
3.1
3.2
(-) Prov. Exp.
2.0
2.1
2.1
1.0
0.9
Adj. NII
0.9
0.7
0.8
2.1
2.3
Other Inc.
2.6
2.1
1.6
1.5
1.6
Op. Inc.
3.5
2.8
2.4
3.6
3.9
Opex
2.0
1.9
2.0
2.0
2.0
PBT
1.5
0.9
0.4
1.6
1.9
Taxes
0.2
0.1
0.0
0.4
0.5
R oA
1.3
0.8
0.4
1.2
1.4
Leverage
7.9
8.0
8.6
9.0
9.3
R oE
10.3
6.5
3.1
10.8
13.2
Valuation done on closing price of 29/07/2019
July 30, 2019
6
ICICI Bank | 1QFY2020 Result Update
Research Team Tel: 022 - 39357800
DISCLAIMER
Angel Broking Limited (hereinafter referred to as “Angel”) is a registered Member of National Stock Exchange of India Limited, Bombay
Stock Exchange Limited, Metropolitan Stock Exchange Limited, Multi Commodity Exchange of India Ltd and National Commodity &
Derivatives Exchange Ltd It is also registered as a Depository Participant with CDSL and Portfolio Manager and Investment Adviser with
SEBI. It also has registration with AMFI as a Mutual Fund Distributor. Angel Broking Limited is a registered entity with SEBI for Research
Analyst in terms of SEBI (Research Analyst) Regulations, 2014 vide registration number INH000000164. Angel or its associates has not
been debarred/ suspended by SEBI or any other regulatory authority for accessing /dealing in securities Market. Angel or its
associates/analyst has not received any compensation / managed or co-managed public offering of securities of the company covered
by Analyst during the past twelve months.
This document is solely for the personal information of the recipient, and must not be singularly used as the basis of any investment
decision. Nothing in this document should be construed as investment or financial advice. Each recipient of this document sho uld
make such investigations as they deem necessary to arrive at an independent evaluation of a n investment in the securities of the
companies referred to in this document (including the merits and risks involved), and should consult their own advisors to de termine
the merits and risks of such an investment.
Reports based on technical and derivative analysis center on studying charts of a stock's price movement, outstanding positions and
trading volume, as opposed to focusing on a company's fundamentals and, as such, may not match with a report on a company's
fundamentals. Investors are advised to refer the Fundamental and Technical Research Reports available on our website to evaluate the
contrary view, if any
The information in this document has been printed on the basis of publicly available information, internal data and other rel iable
sources believed to be true, but we do not represent that it is accurate or complete and it should not be relied on as such, as this
document is for general guidance only. Angel Broking Limited or any of its affiliates/ group companies shall not be in any wa y
responsible for any loss or damage that may arise to any person from any inadvertent error in the information contained in this repo rt.
Angel Broking Limited has not independently verified all the information contained within this document. Accordingly, we cann ot testify,
nor make any representation or warranty, express or implied, to the accuracy, contents or data contained within this document. While
Angel Broking Limited endeavors to update on a reasonable basis the information discussed in this material, there may be regulatory,
compliance, or other reasons that prevent us from doing so.
This document is being supplied to you solely for your information, and its contents, information or data may not be reproduc ed,
redistributed or passed on, directly or indirectly.
Neither Angel Broking Limited, nor its directors, employees or affiliates shall be liable for any loss or damage that may ari se from or in
connection with the use of this information.
Disclosure of Interest Statement
ICICI Bank
1. Financial interest of research analyst or Angel or his Associate or his relative
No
2. Ownership of 1% or more of the stock by research analyst or Angel or associates or relatives
No
3. Served as an officer, director or employee of the company covered under Research
No
4. Broking relationship with company covered under Research
No
July 30, 2019
7